How does it work
Report Creation Process
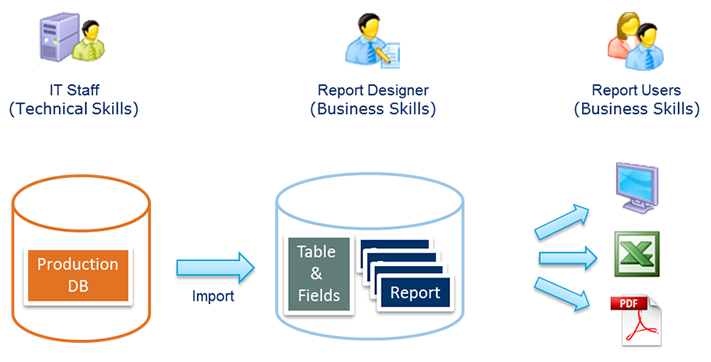
Step 1 - Technical Preparation
IT Staff (Developer) - Technical Skills
IT Staff import the data description/structure (list of tables, columns, relationships) from the database into the repository and add some technical settings.
The result is a list of readable tables and fields (ex: Company, Name Last, First Name).
Step 2 - Report Creation
Report Designer - Business Skills
He defines the report presentation based on predefined templates provided by Reporting Studio.
These templates can be adjusted with tools also provided to modify the cosmetic details of the presentation.
Once saved, we get "interactive reports" that can be run anytime to get new data on the fly.
Step 3 - Production
Report Users
Users select and run the report created by the designer.
The report is generated on the screen with the actual data coming from the database.
They can export the report in various formats to get a static document.
They can also schedule in advance PDF/XLS generation and automatically email the report to a list of contacts.
Reporting Studio® Components
Reporting Studio is composed of the following tools:
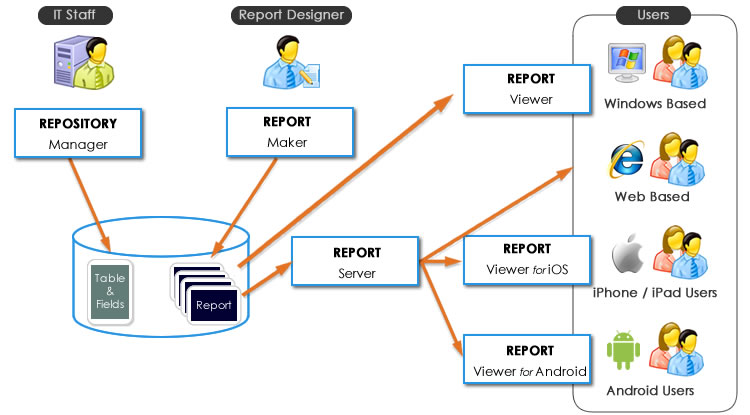
Repository Manager
IT Staff will use the Repository Manager to store all the technical settings. They will import from the database, and prepare the table and fields that the Report Designer will use later to create the reports Read More
The repository is a rich structure used by developers to:
- Select relevant data for business users
Hide technical and confidential fields, such as passwords - Sort fields in a business order
Customer First Name, Last Name, Telephone... - Add virtual fields
Expressions computed on the fly; data calculated when the application is running, such as the total of a purchase order. - Add virtual tables
Business entities that don't exist in the database as a table, such as:
Views: A set of columns coming from one or several tables of the DB.
Data sources: A Stored Procedure, a file, a Web Service, source of information different from a table in the DB.
In the future, Reporting Studio will support more and more types of data sources - Define Business names for table and fields
Replace technical names by user friendly names - Define relationships between tables
For example: Connect "Purchase Orders" with "Products", and "Products" with "Customers"
Set rules to join tables and logical relationships with SQL Queries - outer joints, multiple queries, sub queries, synchronized, etc.
- Provide report templates, and provide standard presentations to your reports
Report Maker
Used by the Report Designer to create the new reports. It allows to select the data and define the layout.
The reports will be stored in the repository.
See an example of easy report creation
Report Viewer
Windows users will install locally an application called Report Viewer to select and run the reports.
Users can analyze and manipulate interactive reports in real time and generate static files (.xls or .pdf).
If Reporting Studio is integrated in a PowerBuilder application, Windows users will be able to access the reports directly from the application.
Report Server
The Report Server will be used to deploy reports to Web and Mobile users.
It will communicate with their web browser.
Mobile users will use a native mobile application relying on Report Server and designed to fit mobile devices screens.
Licensing Model
End-users
- Repository Manager: per-seat license fee
- Report Maker: per-seat license fee
- Report Viewer: Free
- Report Server: per-user license
Software Vendors
Reporting Studio has a special pricing structure for Software Vendors. Please contact us directly to learn more about it.
 Visual
Guard
Visual
Guard